Full year 2013
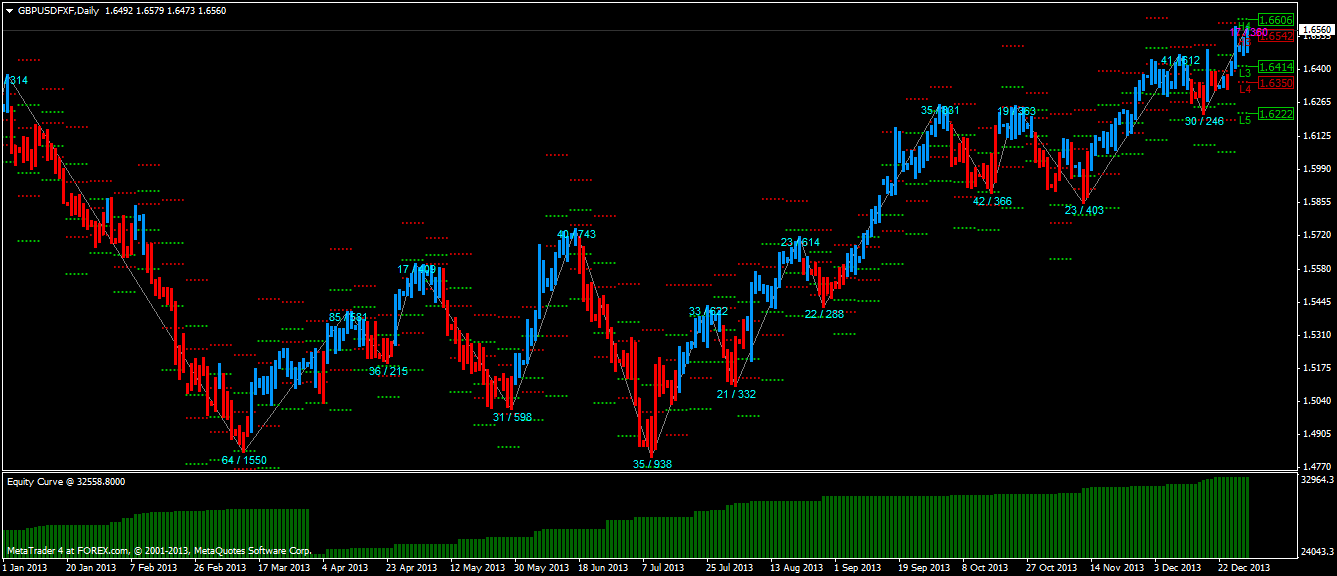
In 2013 we had modest equity growth of 20.1%, or $5,444 net profit after transaction costs. The equity curve/histogram below the price chart tells an interesting story... after three-years of straight-line equity growth we had a major set-back on the 1st of April 2013, the Fools Day!? On that day we lost $3,812 for a very embarrassing reason and we took four months to trade it back! That has taught us an important lesson and will keep us humble. One private equity manager told me that my biggest risk is the complacency and sense of invincibility. Well, we are mere mortals after all and have to stay focused on the market, as it continuously watches us and doesn't miss an opportunity to humiliate us. However, on the positive side, we have contained our enthusiasm and we traded well; we took 122 trades in 2013 (vs 108 trades in 2012 and 196 trades in 2011); we maintained our hit rate over 70% (71% in 2013, 75% in 2012 and 70% in 2011); and we increased our average profit per trade to $205 in 2013, vs $116 in 2012 and $83 in 2011. This means that our trading method is scaling well, without assuming unnecessary risks. Overall we are moderately satisfied with the 2013 results, as it still beats the bank deposit, but we will be stepping-up our game in 2014! Watch this space...
Full year 2012
In 2012 we achieved equity growth of 34%, or $6,922 net profit after swap charges. Our equity curve (or rather histogram) tells the story, but briefly, we started well with 15% gain in the first quarter. Then we traded infrequently for the next 5 months, as we had to focus on our real-life career. We resumed trading towards the end of the year with a good outcome. Overall we are satisfied with the results, as one cannot get 30% return from a bank deposit, although we could have done better, if we had more time on our hands. It is interesting to note that we reduced our risk profile by taking only higher probability trades (108 trades in 2012 vs. 196 trades in 2011); we increased our [profit] hit rate to 75% vs. 70% in 2011 (that is just awesome!); and we increased average profit per trade to $116 from $83 previous year. We can honestly say that we are directionally correct in every dimension!
Full year 2011
Our strategy has served us very well in 2011. We achieved 60.4% equity growth, which can be seen on the equity curve (green histogram below). We are very happy with our performance for three reasons: (1) we beat our 2010 water-mark of 45.8%, (2) we outperformed majority of fund managers, and (3) our strategy performed very well under very tough economic and trading conditions.
Full 2010 results
We had a good year with overall 45.8% equity growth. However, it was a very challenging year with many lessons learnt. These lessons are now built into our strategy for 2011. In the first quarter of 2010 we got off the blocks with a blistering performance of 55% growth. However, we were assuming excessive risk and the performance was not sustainable. This resulted in a large draw-down in the second quarter, when we stopped trading to revisit our assumptions and update our trading strategy. We toned down our apetite for risk (with associated profits) and in the third quarter we achieved solid growth. In the last quarter, we have been honing our risk-mitigating tactics and we further smoothed the equity curve, again with lower profitability. We are satisfied with the overall outcome and we proceed into 2011, climbing on the next wave of Sigmoid curve.
© KrisMarkets - MMXIV